The amount of proven oil reserves awaiting to be exploited fell last year for the first time in a decade, according to new figures released today. The amount of crude left in the ground was 1.258trn barrels - 3bn less than this time last year.
These figures, revealed in the BP Statistical Review of World Energy, are probably the result of a slump in drilling activity due to a fall in the price of oil last year - from $150 per barrel to $30.
At today's rate of use however there is still enough oil to last the next 42 years, according to the oil company although those concerned about Peak Oil say we are closer to running out given demand is expected to rise strongly in the short-term.
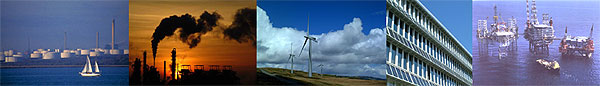
The Statistical Review is used extensively by OPEC and others in the industry as a key text. This year's review shows coal consumption continuing to soar, especially in China, a 70% year-on-year increase in solar capacity and contains a host of other energy gems.
We've extracted the best bits for you - including the data below, which includes:
Where each country gets its energy from
Gas consumption and prices
Coal reserves
Let us know what you do with it.
DATA: the world in energy statistics
Can you do something with this data? Please post us your visualisations and mash-ups below or mail us at datastore@guardian.co.uk
|
Oil proved reserves, Thousand million barrels |
2004 |
2005 |
2006 |
2007 |
2008 |
Change, 2007-2008 |
| US |
29.3 |
29.9 |
29.4 |
30.5 |
30.5 |
- |
| Canada |
16.6 |
17.1 |
27.7 |
28.6 |
28.6 |
- |
| Mexico |
14.8 |
13.7 |
12.8 |
12.2 |
11.9 |
-2.6% |
| Total North America |
60.7 |
60.7 |
70.0 |
71.3 |
70.9 |
-0.4% |
| Argentina |
2.5 |
2.2 |
2.6 |
2.6 |
2.6 |
- |
| Brazil |
11.2 |
11.8 |
12.2 |
12.6 |
12.6 |
0.1% |
| Colombia |
1.5 |
1.5 |
1.5 |
1.5 |
1.4 |
-9.8% |
| Ecuador |
5.1 |
4.9 |
4.5 |
4.0 |
3.8 |
-4.6% |
| Peru |
1.1 |
1.1 |
1.1 |
1.1 |
1.1 |
- |
| Trinidad & Tobago |
0.8 |
0.8 |
0.8 |
0.9 |
0.8 |
-4.7% |
| Venezuela |
79.7 |
80.0 |
87.3 |
99.4 |
99.4 |
- |
| Other S. & Cent. America |
1.3 |
1.3 |
1.4 |
1.4 |
1.4 |
-0.6% |
| Total S. & Cent. America |
103.2 |
103.4 |
111.4 |
123.5 |
123.2 |
-0.3% |
| Azerbaijan |
7.0 |
7.0 |
7.0 |
7.0 |
7.0 |
- |
| Denmark |
1.3 |
1.3 |
1.2 |
1.1 |
0.8 |
-27.1% |
| Italy |
0.8 |
0.8 |
0.8 |
0.9 |
0.8 |
-4.5% |
| Kazakhstan |
39.6 |
39.8 |
39.8 |
39.8 |
39.8 |
- |
| Norway |
9.7 |
9.7 |
8.5 |
8.2 |
7.5 |
-8.2% |
| Romania |
0.5 |
0.5 |
0.5 |
0.5 |
0.5 |
- |
| Russian Federation |
76.8 |
77.6 |
79.0 |
80.4 |
79.0 |
-1.7% |
| Turkmenistan |
0.5 |
0.5 |
0.6 |
0.6 |
0.6 |
- |
| United Kingdom |
4.0 |
3.9 |
3.6 |
3.4 |
3.4 |
- |
| Uzbekistan |
0.6 |
0.6 |
0.6 |
0.6 |
0.6 |
- |
| Other Europe & Eurasia |
2.2 |
2.2 |
2.2 |
2.1 |
2.1 |
-2.2% |
| Total Europe & Eurasia |
143.1 |
143.8 |
143.8 |
144.6 |
142.2 |
-1.7% |
| Iran |
132.7 |
137.5 |
138.4 |
138.2 |
137.6 |
-0.4% |
| Iraq |
115.0 |
115.0 |
115.0 |
115.0 |
115.0 |
- |
| Kuwait |
101.5 |
101.5 |
101.5 |
101.5 |
101.5 |
- |
| Oman |
5.6 |
5.6 |
5.6 |
5.6 |
5.6 |
- |
| Qatar |
27.0 |
26.9 |
27.9 |
27.4 |
27.3 |
-0.6% |
| Saudi Arabia |
264.3 |
264.2 |
264.3 |
264.2 |
264.1 |
-0.1% |
| Syria |
3.2 |
3.0 |
3.0 |
2.5 |
2.5 |
- |
| United Arab Emirates |
97.8 |
97.8 |
97.8 |
97.8 |
97.8 |
- |
| Yemen |
3.0 |
2.9 |
2.8 |
2.7 |
2.7 |
- |
| Other Middle East |
0.1 |
0.1 |
0.1 |
0.1 |
0.1 |
- |
| Total Middle East |
750.2 |
754.5 |
756.3 |
755.0 |
754.1 |
-0.1% |
| Algeria |
11.8 |
12.3 |
12.3 |
12.2 |
12.2 |
- |
| Angola |
9.0 |
9.0 |
9.0 |
13.5 |
13.5 |
- |
| Chad |
0.9 |
0.9 |
0.9 |
0.9 |
0.9 |
- |
| Rep. of Congo (Brazzaville) |
1.8 |
1.9 |
1.9 |
1.9 |
1.9 |
- |
| Egypt |
3.6 |
3.7 |
3.7 |
4.1 |
4.3 |
6.6% |
| Equatorial Guinea |
1.8 |
1.8 |
1.8 |
1.7 |
1.7 |
- |
| Gabon |
2.2 |
2.1 |
2.2 |
3.2 |
3.2 |
- |
| Libya |
39.1 |
41.5 |
41.5 |
43.7 |
43.7 |
- |
| Nigeria |
35.9 |
36.2 |
36.2 |
36.2 |
36.2 |
- |
| Sudan |
6.4 |
6.4 |
6.6 |
6.7 |
6.7 |
- |
| Tunisia |
0.7 |
0.6 |
0.6 |
0.6 |
0.6 |
- |
| Other Africa |
0.6 |
0.6 |
0.6 |
0.6 |
0.6 |
|
| Total Africa |
113.8 |
117.0 |
117.3 |
125.3 |
125.6 |
0.2% |
| Australia |
4.1 |
4.2 |
4.2 |
4.2 |
4.2 |
|
| Brunei |
1.1 |
1.1 |
1.2 |
1.1 |
1.1 |
- |
| China |
15.5 |
15.6 |
16.3 |
16.1 |
15.5 |
-4.2% |
| India |
5.6 |
5.9 |
5.7 |
5.5 |
5.8 |
6.2% |
| Indonesia |
4.3 |
4.2 |
4.4 |
4.0 |
3.7 |
-6.0% |
| Malaysia |
5.2 |
5.3 |
5.4 |
5.5 |
5.5 |
- |
| Thailand |
0.5 |
0.5 |
0.5 |
0.5 |
0.5 |
- |
| Vietnam |
3.1 |
3.1 |
3.2 |
3.4 |
4.7 |
38.7% |
| Other Asia Pacific |
1.0 |
1.0 |
1.0 |
1.1 |
1.1 |
w |
| Total Asia Pacific |
40.3 |
40.8 |
41.8 |
41.3 |
42.0 |
1.8% |
| Total World |
1211.3 |
1220.3 |
1240.6 |
1261.0 |
1258.0 |
-0.2% |
| European Union |
7.5 |
7.3 |
6.9 |
6.7 |
6.3 |
-5.8% |
| OECD |
81.9 |
81.8 |
89.5 |
90.3 |
88.9 |
-1.5% |
| OPEC |
923.3 |
930.9 |
940.0 |
957.1 |
955.8 |
-0.1% |
| Non-OPEC £ |
162.8 |
163.1 |
172.8 |
174.7 |
174.4 |
-0.2% |
| Former Soviet Union |
125.2 |
126.2 |
127.8 |
129.2 |
127.8 |
-1.1% |
| Canadian oil sands |
163.6 |
163.5 |
152.2 |
150.7 |
150.7 |
|
| Proved reserves and oil sands |
1374.9 |
1383.8 |
1392.8 |
1411.7 |
1408.7 |
|
www.guardian.co.uk