

A reduction in global oil production capacity will mean that higher future oil price will be attained at a lower level of demand than in 2008. Is another oil price spike on the way?
|
|
|
Posted by Euan Mearns
A reduction in global oil production capacity will mean that higher future oil price will be attained at a lower level of demand than in 2008. Is another oil price spike on the way?
One thing that was anticipated in the run up to peak oil was that the oil price would become volatile. Volatility leads to uncertainty creating difficulties for national governments, economic planning agencies and oil companies to plan ahead. One consequence of this has been the postponement of many large new oil field developments creating concern that future supplies may be insufficient to meet demand leading to a new oil price crunch in the years ahead.
So what is the right price for oil? To what extent can market mechanisms be relied upon to strike the right price? Is it possible to make sense of the volatile price signal shown in Figure 1?

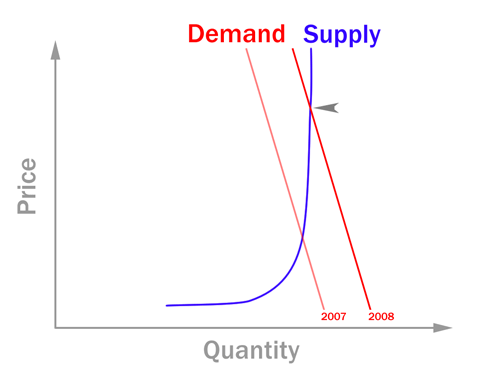
Last year Phil Hart provided us with a model to explain the relationship between oil supply, demand and price (Figure 2). Put simply, demand is inelastic in that it does not vary much owing to price variations alone - we still drive our cars even though it gets more expensive to do so. Supply used to be elastic (the flat part of the supply curve), higher prices easily translating to higher supply. In the real world this meant OPEC opening the taps on spare capacity. But then in 2004 the supply rules changed. OPEC spare capacity effectively fell to zero (Figure 1) and new supply became inelastic (steep part of the curve), i.e. higher prices did not lead to a ready flow of new oil since new capacity had to be built, at great expense, using expensive energy. The result was escalating prices and the spike of 2008.
Somewhat surprisingly (for me at least) cross plotting the data from Figure 1, provides a picture that is still consistent with Phil's simple model (Figure 3). To understand Figure 3, the blue line is a time line, charting the evolution of supply / demand and price since January 2002 through to June 2009. Once production hit 84 mmbpd (million barrels per day) the plateau was effectively reached and expanding capacity in the face of 4.5% annual decline became an arduous task. Prices rose to keep supply and demand in balance until the peak in July 2008 when the economic crisis took hold leading to a collapse in demand.
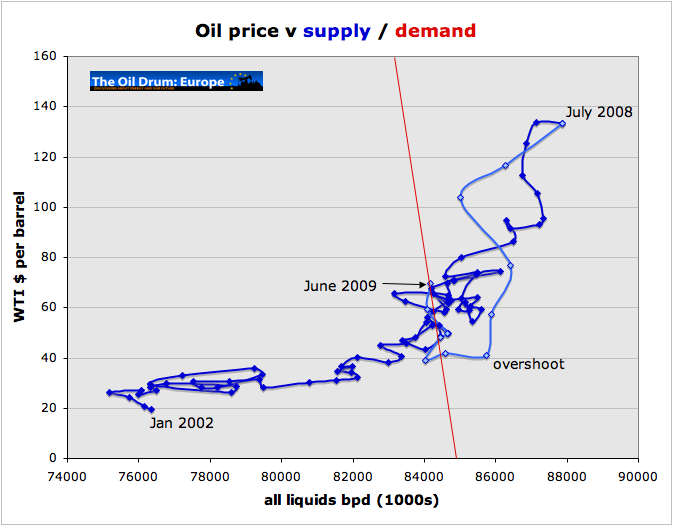
Following the time line down from the July 2008 peak, the oil price overshot its mark by about $40, but since then it seems to have been correcting back towards the trend set during the ascent. First, the price stabalised at $40, tracking left as demand continued to fall. And then demand stabalised at about 84 mmbpd and the price rose from 40 to over $70 per barrel. The June 2009 position is within the trend set during the price ascent of 2006 and 2007, and on this basis I'd conclude that we have seen a correction back towards market equilibrium rather than a "dead cat bounce" in oil price.
The integrity of this trend from January 2002 to June 2009 is surprising since there have been large movements in OPEC spare capacity, which is adjusted to maintain supply in balance with demand. I suspect the fundamental reason to explain this is that global production capacity has remained fairly constant throughout this period. If there was to be a dramatic increase or decrease in productive capacity then this trend would break down
So that leaves the $60,000 question. Where next for the oil price? I believe that plateau supply of 84 to 88 mmbpd are secure for a couple of years as this summary of mega-projects compiled by Tony suggests (Figure 4). Therefore, the near term price will be controlled by demand. If the trend of Figure 3 holds good, then we could expect prices to rise towards $80 / bbl if demand rises by 2 mmbpd (likely spiking higher than that) or conversely falling to below $40 / bbl if demand drops a further 2 mmbpd, which is the scenario considered by Rune last month.

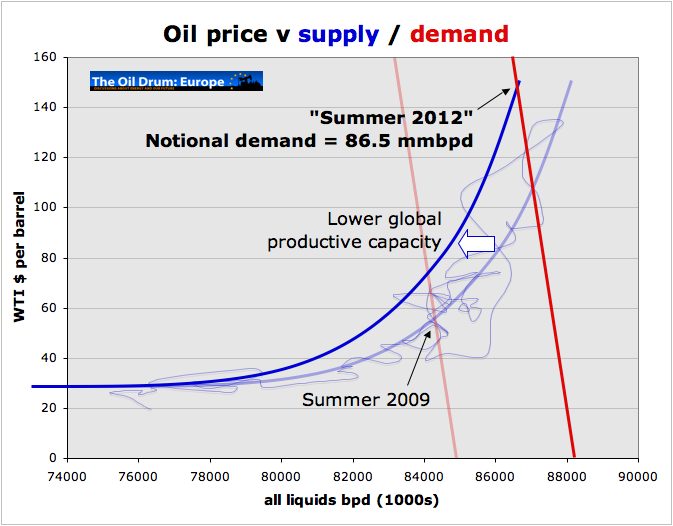
Longer term, productive capacity will begin to play a role and one can envisage how a fall in capacity of around 1 mmbpd may shift the supply demand relationship to the left. Combined with marginal growth in demand will result in a new price spike as shown in Figure 5. It is impossible to be precise on timing, but my best guess would be 2012±2 years, subject to the global banking system surviving the current crisis and the global economy resuming growth in 2010.
In a recent post I argued that there was a limit to the oil price that the global economy can bear. Any new price spike, as the name suggests, will be short lived as high price will kill demand and we will likely see a repeat performance of the 2008 crisis. At some point global leaders need to awaken to the prospect of that supply curve marching to the left, always.