|
|
|
|
|
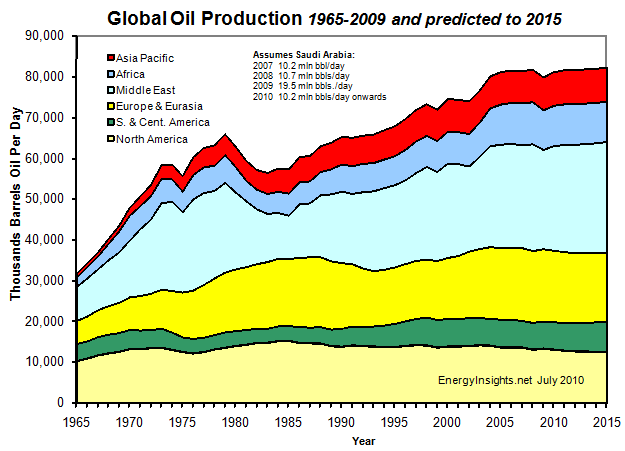
Oil prices rose to ca. >$75/bbl by Q3 2009 and therefore stimulated more investment which has likely delayed a severe decline for a few more years. As per last years report, we are on a bump Peak Oil production plateau - EnergyInsights.net believes Peak Oil was July 2008. All the below analysis is based on oil prices recovering to ca. $75/bbl by end 2009. If this does not happen, we expect oil production and consumption to decline by ca. 2-4% per annum from now onwards. If oil prices stay above $75/bbl - we expect oil production to recover to approximately July 2008 levels by 2011 - then stay on this bumpy plateau, before starting to decline ca. 2014-2015 at levels of ca. 1 to 4% per annum - same as last year. We have updated our charts based on the latest June 2010 data from BP Statistical Review. No change to outlook - optimistically, there will be a bumpy plateau. A decline could be precipitated if war broke out. It has been remarkably peaceful since 2003 - whether this continues is debatable.
Peak Oil
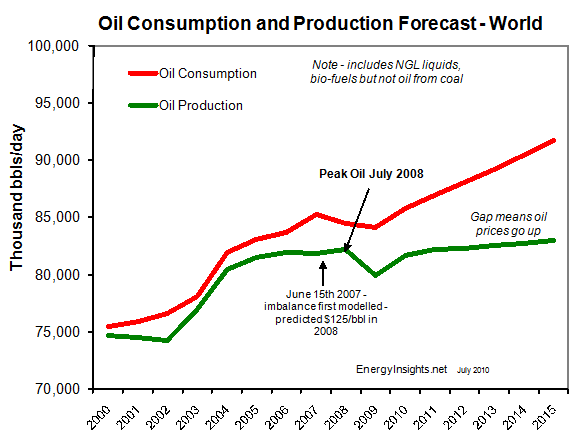
The above production forecast was added June 2010 - based on our model of combined country production forecast and consumptions forecasts - assuming major recession end 2008 to end 2009, then moderate GDP recovery starting early 2010 (oil price $80/bbl 2010 rising thereafter).
This unqiue EnergyInsights.net Special Report on Peak Oil shows the latest insights into oil production trends globally, including our unqiue "bottoms-up" oil production forecasts per country from present to 2015 - including the last economic situation of late 2008. We expect oil production and consumption to decline by ca. 0.5 million barrels a day in 2009 before recovering in 2010 and growing thereafter. However, be expect production to be bumping along a pleateau until 2015 and oil prices will have to be >$75/bbl to keep it on this plateau. We believe total oil production is unlikely ever to exceed July 2008 levels ("the peak") - with new oil more or less matching depletion until after 2015 when production is likely to start a steady decline.
The are many theories around on oil production levels in future years - we believe ours to be paricularly accurate because they are based on in-depth modeling of of every country's oil production history and due consideration for their recent discoveries, resources challenges in production, infra-structure and investment climates. These insights have been incorporated into our model and are presented below.
In summary - we are at a global oil production plateau now and heading for significant decline of investment levels do not pick up quickly - and EnergyInsights.net does not expect to see further overall world oil production growth in future years. Because of this, the dash to renewables, coal, gas, nuclear, electric and other forms of energy will start gaining momentum after the oil price spike-shock of mid 2008 ($147/bbl) and oil prices will again rise sharply when the global recession ends - probably late 2009 to mid 2010. Supply again will not keep pace with demand unless oil prices rise. It seems demand destruction (and recession) occur after oil prices rise above ca. $100/bbl. We expect oil price volatility to be common place in years to come.
Peak Oil Production - Global - since 1965 and forecast to 2015 - note: if investment levels do not pick up quickly, we expect oil production NOT to recover to July 2008 Peak Oil levels
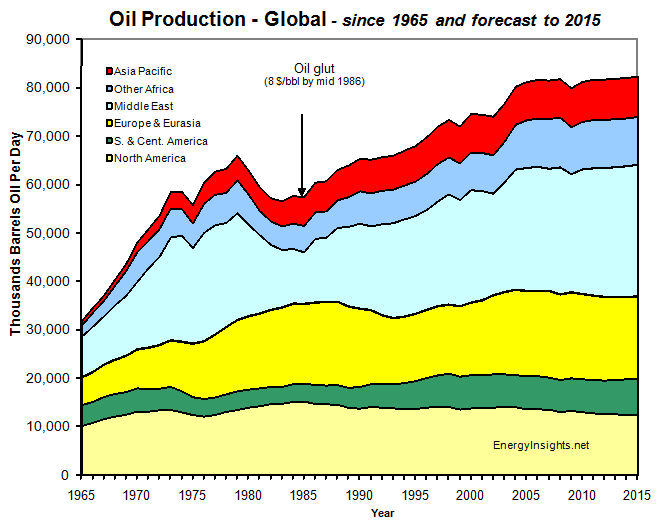
| Oil production globally has been growing over the last 50 years, apart from a drop in the early 70s and again in the early 80s after oil prices spiked upwards causing recessions. This indicates the historical sensitivity of oil consumption to oil price. OPEC production is seen as the swing producer - these producers capture spare demand and decrease production if oversupply drives prices down. The end 2008 recession is also leading to reduced supply from OPEC as they cut production to support prices that dropped to $34/bbl mid December 2008 and have only marginally recovered to $42/bbl by early March 2009. |
| Most region's oil production has increased over the years, particularly Europe (North Sea and Russia) and Asia Pacific. North Amercia production has been more constant. Middle East (mainly OPEC production) has fluctuated - acting as a "swing prducer" - generally increasing during periods of high oil price and decreasing during period of low oil price. However, OPEC without further massive investment will find it very difficult to increase production over July 2008 levels. |
|
|
|
Crude Oil Price: OPEC and Middle East production dropped from 1980 until 1985 as OPEC attemped to support oil prices - however, in 1986, Saudi Arabia flooded the market and drove prices down to below $8/bbl for a few week in an attempt to curtain non OPEC developments and production. It was some 3-4 years before prices started to recover, but in US real terms, prices are still well below the levels seen in 1980 and at approximately the late 1970s level. In addition, GDP and industry is far less reliant on oil - oil constitutes far proportionally within the overall GDP of the USA - the US GDP has also grown significantly since the early 1980s - mianly service sector growth. |
 |
 |
| Gross oil sales per region - this is the summation of the oil produced times the price of the crude in the given year. |
|
|
| Increases and decreases in oil production in 2006 (from June 2007 data) |
 |
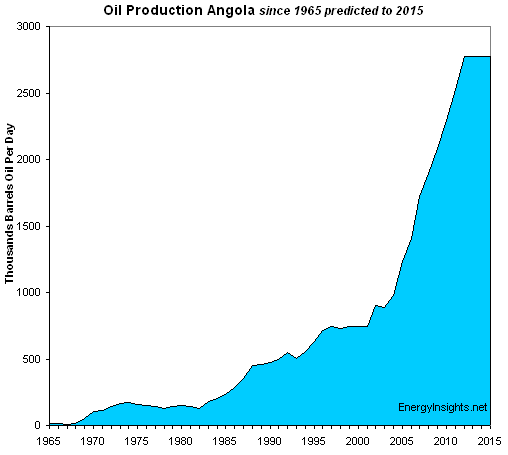
| Peak Oil Production in Africa - is expect 2014 (1995 and forecast to 2015). Most growth will be in Angola, but if developments are cancelled because of low oil prices, we expect Peak Oil to be in the next few years in Africa. |
|
|
| Oil Production Peaking in Middle East - from 1995 and forecast to 2015. We expect production to recover after oil prices rise, BUT we do not expect any further significant growth within the region. Iraq is the exception - with production rising to ca. 3.4 million bbls/day (albeit will below true potential of 6.5 million bbls/day). |
|
|
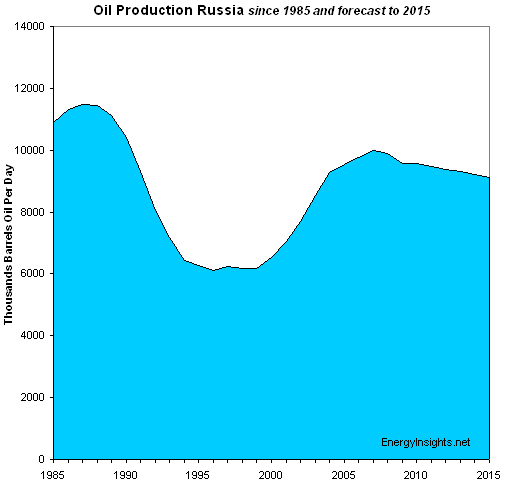
| Peak Oil Production in Europe & Euroasia - from 1995 and forecast to 2015. Oil production peaked in 2006. Russian oil production peaked in 2008 - at a rate of 9.6 mill bbls/day. It is now at 9.2 mill bbls/day - and we expect a decline to set in of ca. 2% per annum from now onwards. We expect Russia to be a net importer of oil by 2027. It will however still have massive gas reserves and production, plus production of coal. |
|
|
| Oil Production in South America - from 1995 and forecast to 2015 |
|
|
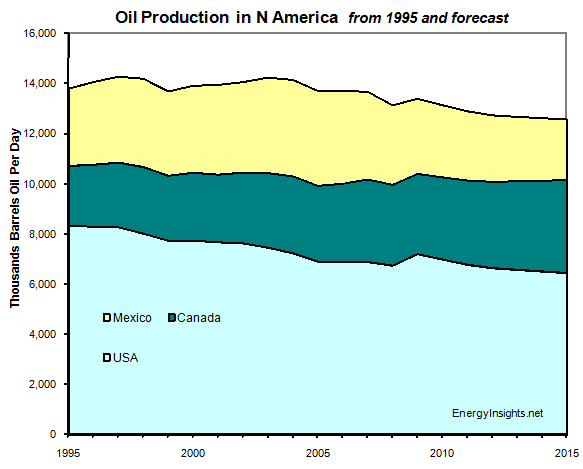
| Peak Oil Production - in North America - Oil peaked in the region 2003-2004 (from 1995 and forecast to 2015). Note: Mexico will be a net importer of oil in about 7 years time. |
 |
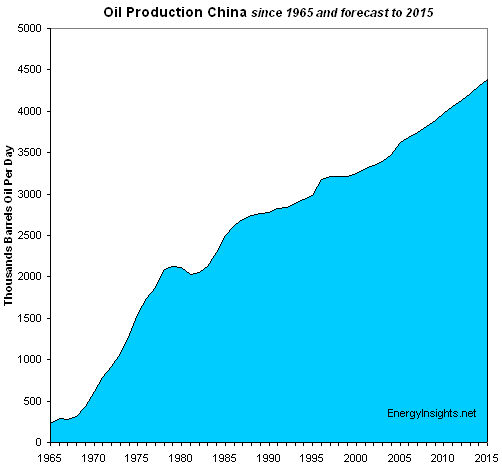
| Oil Production in Asia Pacific - from 1995 and forecast to 2015. We expect China to continue discovering oil reserves an agressively developing them, hence oil production in Asia will not peak up to 2015 espite declining reserves as long as China continues discovering and developing offshore oil fields. |
|
|
| Peak Oil Production - World Global- (from 1995 and forecast to 2015, predicated on >$75/bbl). Please note, if oil prices do not recover to $75/bbl by end 2009, we believe Peak Oil "was" July 2008. In any case, after 2015 we see a significant decline in oil production a rates of 1-4% per annum. This even if oil prices rise above $100/bbl. |
|
|
|
Oil Production - World Global- from 1965 and forecast to 2015
|
|
|
| Oil Production Middle East- from 1965 and forecast to 2015. If Iraqi production does not increase significantly in the next few years, we believe peak oil in the Middle East would have been Julu 2008. However, we expect increased activity levels and a slight increase over July 2008 levels from mid 2010 onward as the global economy comes out of recession. But, increased Middle East oil demand will mean that overall export do not rise further from July 2008 levels. |
|
|
| Peak Oil Production - in Europe and EuroAsia - from 1965 and forecast to 2015 |
|
|
| Peak Oil Production - South America - from 1965 and forecast to 2015. If Brazil does not rapidly develop it's new offshore oil discoveries, oil will ahave peaked in South America in 1997. Any delay in deepwater investment caused by low oil prices will confirm this. The only increase is Brazil after 2012 assuming >$75/bbl and stable economic environments in the 3 years before this as developments are executed. |
|
|
| Oil Production Venezuela - from 1965 and forecast to 2015 - note steep decline since 1997 shows no signs of slowing despite higher oil prices. We expect Venezuela oil production to continue to decline - a massive increase in investment is required to reverse this decline, something we believe is unlikely in the current global economic climate. |
|
|
| Peak Oil Production - North America - from 1965 and forecast to 2015 - as a continent, oil has actually increased from 10 million bbls/day in 1965 to 14 million bbls/day today - and is forecast to remain on a plateau until 2015 - mainly from increases in canada offsetting decreases in Mexico and USA. |
|
|
|
Oil Production in Asia Pacific - from 1965 and forecast to 2015 |
|
|
| Oil Production Africa - from 1965 and forecast to 2015 |
|
|
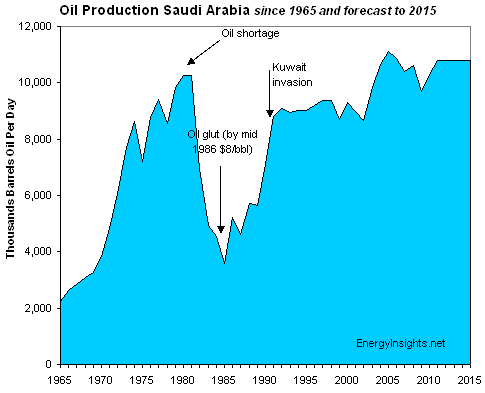
| Oil Production Saudi Arabia - from 1965 and forecast to 2015 |
 |
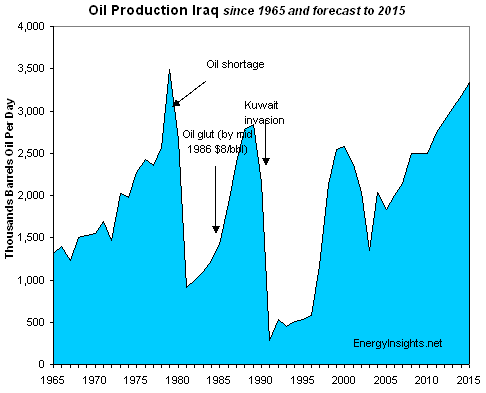
| Oil Production Iraq - from 1965 and forecast to 2015 |
 |
| Oil Production Venezuela - from 1965 and forecast to 2015 |
|
|
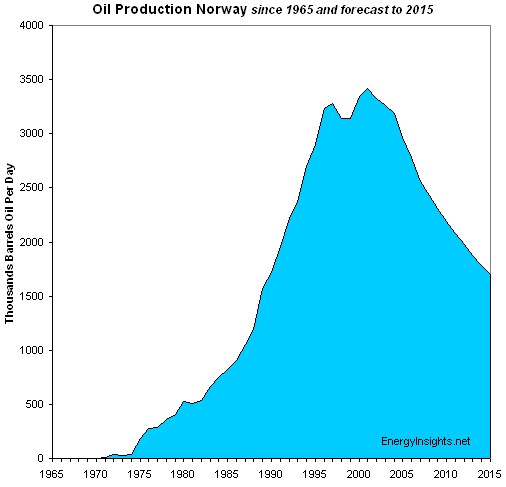
| Oil Production Norway - from 1965 and forecast to 2015 |
 |
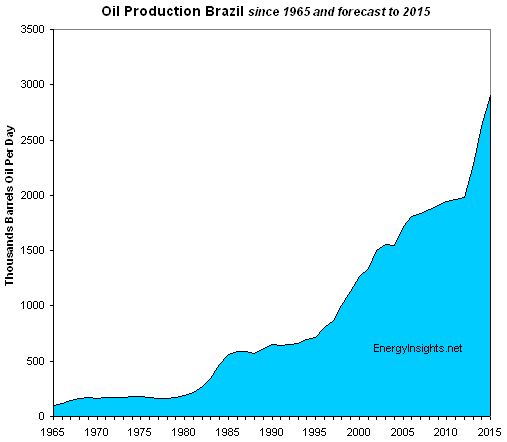
| Oil Production Brazil - from 1965 and forecast to 2015 (assumes $80/bbl from end 2009) |
 |
| Oil Production Russia - from 1985 and forecast to 2015 |
 |
| Oil Production China - from 1965 and forecast to 2015 |
 |
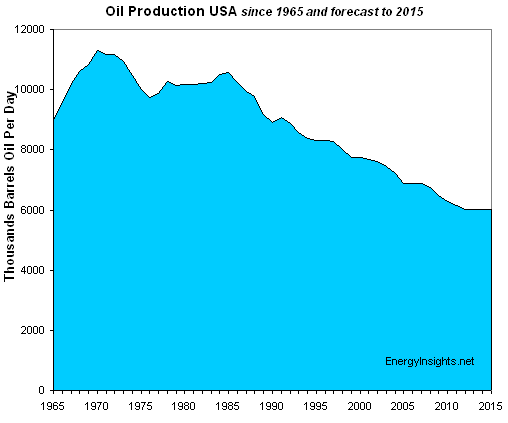
| Oil Production USA - from 1965 and forecast to 2015 |
 |
| Oil Production Canada - from 1965 and forecast to 2015 |
|
|
| Oil Production Mexico - from 1965 and forecast to 2015 |
|
|
| Oil Production Angola - from 1965 and forecast to 2015 |
 |
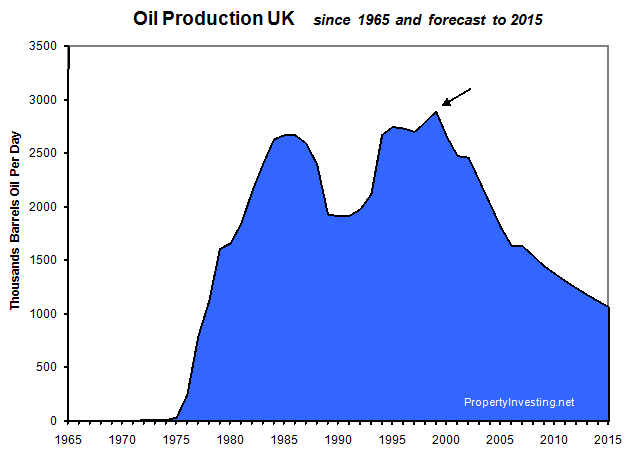
|
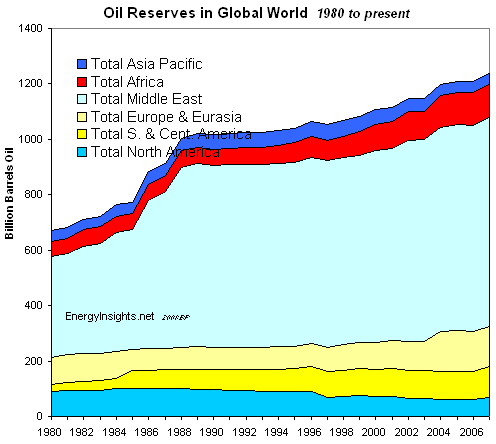
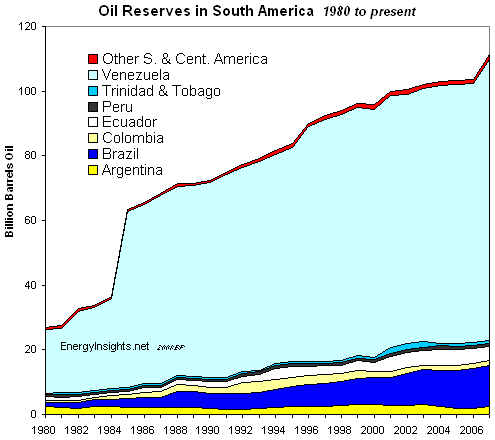
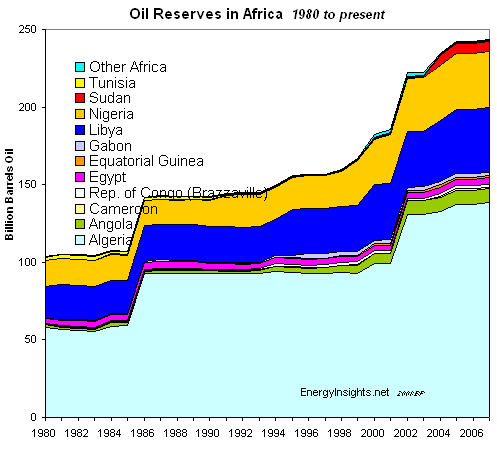
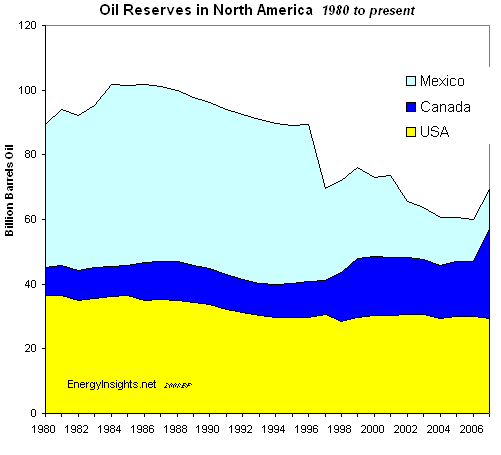
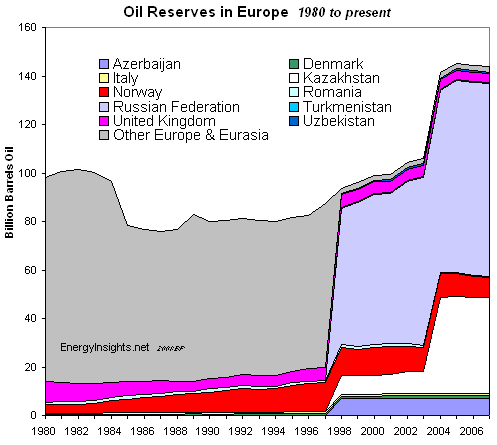
Oil reserves have steadily increased since 1980, though there are big debates about how accurate these estimates of proven reserves actually are. Many countries do not have externally verified (audited) reserves - transparency is not high - and hence the overall global reserves picture remains uncertain. Reserves also depend on the oil price - if oil prices drop (as they did end 2008 from $147/bbl to $35/bbl) oil reserves should drop. It takes at least a year for these numbers to filter through. Many heavy oil fields will not be economic (e.g. proven reserves) if oil prices stay below $50/bbl. Furthermore, the dollar decline in value over many other global currencies means oil at ca. $40/bbl in todays money is only worth ca. $25/bbl in 2000 money. The abilityto increase oil reserves from now onwards will be constrained by levels of investment - if oil prices stay low, oil reserves will also drop. We make no attempt to forecast reserves growth or decline. Suffice it to say - easy oil production is now behind us, and the remaining reserves are in more challenging environments:
We expect reserves to stay fairly constaint in years to come, but oil production is we believe on a plateau and will not again reach the peak it did January 2008. Also note, many of the most recent reserves additions are high cost, in technically and environmentally challenging areas (deepwater, frozen-cold regions, deep, high temperature/pressure, sub-salt, in freshwater lakes)
Global Oil Reserves Per Region - since 1980 | |
 | |
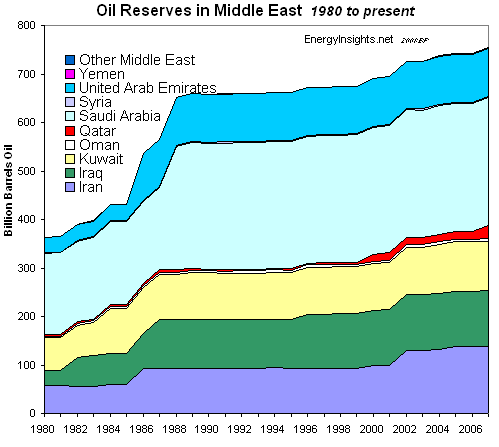
| Oil Reserves Middle East region - since 1980 | |
 | |
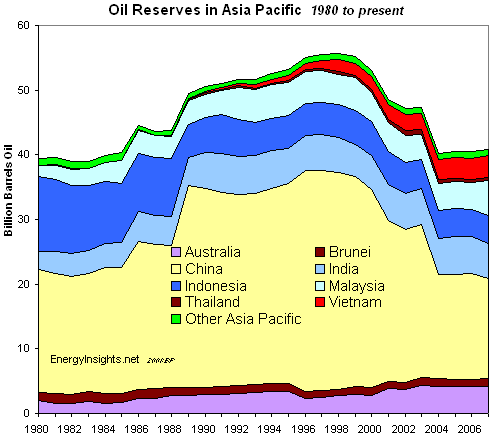
| Peal Oil - Oil Reserves Asia Pacific region - peaked in 1996 | |
 | |
| Oil Reserves South America region - since 1980 (note: the reserves increases in Venezuela were made during a high oil price period - heavy high cost oil - expect these reserves to drop back at $40/bbl) | |
 | |
| Oil Reserves Africa region - since 1980 | |
 | |
| Peak Oil - Oil Reserves North America region peaked in 1985 | |
 | |
| Peak Oil - Oil Reserves Europe region (including Russia) peaked in 2005 | |
 | |
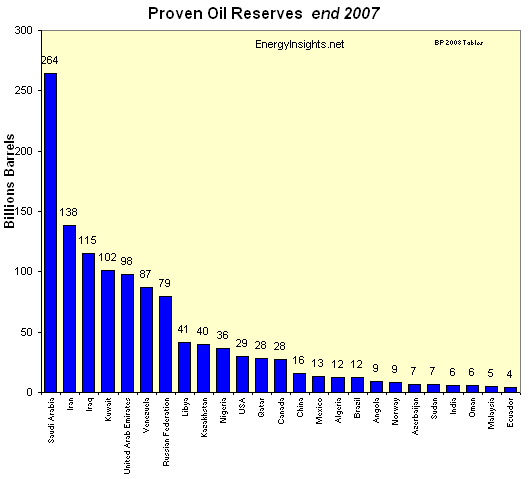
| Proven Oil Reserves - in major countries by reserves size at end 2007 | |
 | |
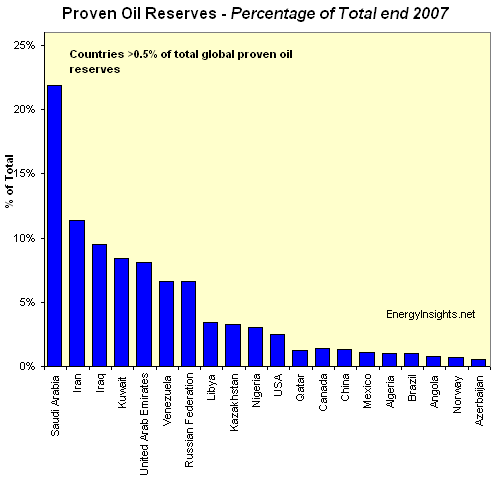
| Proven Reserves - major countries (top 20) by reserves size | |
 | |
| Oil Production Increase - per region in 2006 compared to 2005 - in barrels per day - note remarkable stability as a percentage when considering the total world oil prdoction of ca. 85 million barrels per day | |
.gif) | |
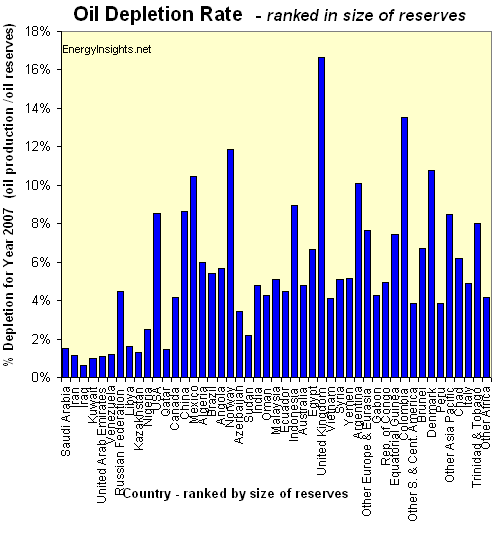
| Oil Depletion Rates - ranked by size of reserves - the highest reserves are to the left and lowest to the right - in major countries by reserves countries - as of end 2007. UK has highest depletion rate of 17% with Saudi Arabia, Iran, Iraq and Kuwait the lowest at 1-2% per annum (implying ca. 50 to 100 years of production at current rates). | |
 | |
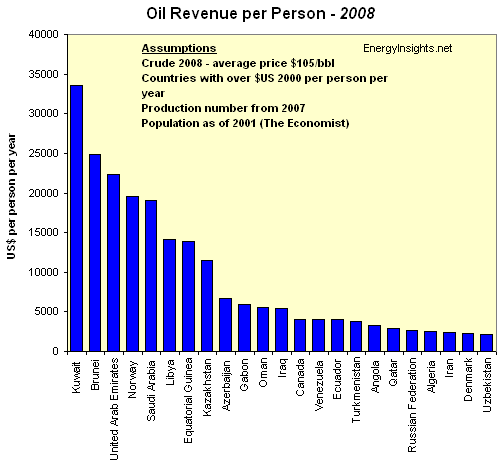
| Oil Revenue Per Person per Country in 2008 - in major countries by reserves size. Note at ca. $105/bbl average in 2008, Kuwait delivered a sttaggering $33,500 per person. Brunei follws with $25,000 then UAE and Norway - at around $20,000 per person. These are some of the richest countries in the world if oil prices rise above ca. $50/bbl. | |
 | |
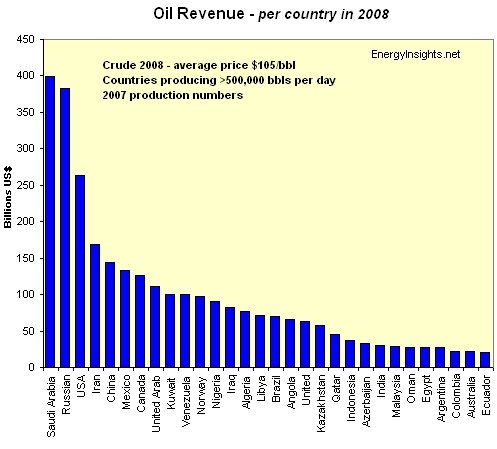
| Oil Revenue per Country in 2008 - in major oil producing countries. Note Saudi Arabia and Russia head the list with production at ca. 9.5 million barrels a day. Both countries export most of their oil. USA is third but is a large net importer of ca. 8 million barrels a day. | |
 | |
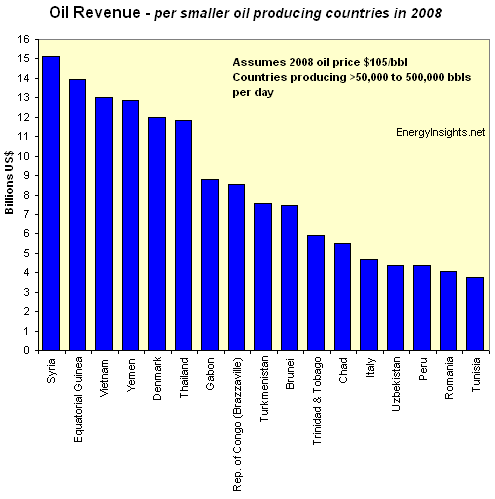
| Oil Revenue per Smaller Oil Producting Country in 2008 - in major oil producing countries (note: gross produced revenue, not net or net exported revenue or profit). Based on 2008 oil price and 2007 oil production. | |
 | |
| Oil Production per Country in 2007 - in major oil producing countries. Note Russia and Saudi Arabia are the biggest oil producers. Followed by USA. However, USA importa ca. 8 million barrels a day, whilst Saudi exports the bulk of it's oil. | |
|
| |
| Gross Oil Sales Per Region - 1972 to present, and forecast to 2015 based on the below oil price forecast. This chart shows the total region's oil production multiplied by the average oil price in that year (benchmarked to Dubai price). Note - the price forecast is uncertain, but with prices crashing from $147/bbl to $33/bbl from July 2008 to Dec 2008, we expect prices to recover as the recession ends - thence tightening of supply and increase in demand to drive up prices end 2009. | |
|
| |
| Cost of Oil Per Region - 1972 to present, and forecast to 2015 based on the below oil price forecast. This chart shows the total region's oil cost - this is the oil consumption multiplied by the average oil price in that year (benchmarked to Dubai price). Note - the price forecast is uncertain, but with prices crashing from $147/bbl to $33/bbl from July 2008 to Dec 2008, we expect prices to recover as the recession ends - thence tightening of supply and increase in demand to drive up prices end 2009. | |
|
| |
| Net Oil Exports and Imports Per Region - 1972 to present, and forecast to 2015. Note the massive Fast Eastern draw on oil in years to come. Europe region is only slightly negative only because Russia is added into this region. Middle East are the clear exporters - with Africa another net exporter (85% from Libya, Algeria, Nigeria and Angola). | |
|
| |
| Global Oil Cost Deficits and Surplus Per Region - 1972 to present, and forecast to 2015. Using historical oil prices before end 2008, and oil price forecast below up until 2015. Note recession impacts 2009 and 2010 - as Middle East cuts back oil and the oil price crashes, before recovering end of decade. | |
|
| |
| Global Oil Cost Deficits and Surplus Per Region - 2000 to present, and forecast to 2015. Using historical oil prices before end 2008, and oil price forecast below up until 2015. Note recession impacts 2009 and 2010 - as Middle East cuts back oil and the oil price crashes, before recovering end of decade. | |
|
| |
|
Oil Producing in Smaller Producing Country in 2007 | |
|
| |
|
Oil Production - Major Percentage Increase and decrease - 2006 compared to 2005. Note Angola is the world biggest % increaser in oil production. This is likely to continue in 2008 and possible 2009. Chad is in decline as is UK and Turkmenistan - this is also likely to continue in 2008 and 2009. However, OPEC (mainly Middle Eastern) countries will cut back production end 2008 and early 2009. | |
|
| |
|
Asia Crisis Peak Oil Production Costs
|
|
|
|
Africa Oil Boom - Production Exports Forecast |
|
|
|
|
|
Europe Debt Oil Production - Deficit and Surplus |
|
|
|
Global Oil-Revenue per Region - Peak Oil Production Crisis |
|
|
|
Middle East - Boom - Peak Oil Production |
|
|
|
Middle East Export Oil Production - Crisis and Production Population Explosion |
|
|
|
Net Oil Exports and Imports - Middle East |
|
|
|
China and Asian - Net Oil Imports Crisis |
|
|
|
Oil Boom Revenue Per Person in Africa |
|
|