|
|
|
|
|
Oil Crash: There are some very interesting dynamics occurring in the oil-commodities sector that will help shape inflation and property investing expectation for the next few years. Its important for property investors to understand the dynamics and ramification to protect their assets and seize on any global investing opportunities.
Market Share: In November, Saudi Arabia with support from its neighbouring Arab friends UAE and Kuwait decided to pledge to keep their production rates stable and watch the price of oil drop to more market driven levels. They were not willing to give up market share and be the swing producers either collectively or singularly. At the time, it was probably anticipated that oil prices would drop, but we think anyones been surprized how sharply oil prices have collapsed in the last 6 weeks.
Saudi Strategy: So exactly why does Saudi Arabia and a few key allies decided to let the oil price drop so sharply? There are many intertwining explanations, any one or grouping of them could be the reason. Saudi wants to:
· Put financial pressure on Iran their regional competitor and about to develop enough high grade plutonium to make nuclear bombs
· Put financial pressure on ISIS help reduce financial support for their oil smuggling operations
· Put financial pressure on Russia who have recently overtaken Saudi Arabia as number one oil producer in the world
· Put financial pressure on higher cost producers like Iran, Nigeria, Russia and Venezuela also not considered friends
· Put financial pressure on the US shale oil fraccing companies about 4 million bbls of extra oil supply has come on-line since 2009 from shale oil fraccing in North Dakota and Texas, with unit technical costs to produce of $40-$70/bbl
· Put a stop to new green renewable energy sources that were just beginning to gain significant market share e.g. solar, wind, ethanol many of these projects will need to be cancelled
· Take back market share from natural gas that has slowly been eating into oils energy dominance with new natural gas powered vehicles in the US
· Send a signal to large capital intensive gas-LNG projects that oil is again competitive and clip the wings of their regional rival Qatar (the worlds largest LNG producer)
· Work in cahoots and doing a deal with the US that they both flood the market with oil and in return the US supplies military hardware and expertise to Saudi to help defeat ISIS and secure the House of Saudi from its detractors, whilst hitting Russia (over Ukraine) and Iran (over their nuclear aspirations)
Weathering The Storm: Because Saudi Arabia has such huge foreign reserves built up over the last five years at $100/bbl it can weather the financial burden of say $51/bbl oil even though their budget is based on $100/bbl. They may just use part of their dollar reserves to fund the price drop. In the long term, they would prove they are the number one oil player in the Middle East, clip the wings of Iran and Russia and get friendly with key customers in western Europe, China, Japan and USA.
Its easy to imagine any of the above as being reasons but if you take them all together and its certainly not difficult to see Saudis logic.
As we all know, the oil business tends to go in boom and bust cycles. This bust cycle seems to be engineered and if it can hit the renewables and oil-shale fraccing business plus the people Saudi and USA least like, it could pave the way to stopping key projects for years, then create a supply constraint in about 2 years time that would then put Saudi back in control of OPEC riding high again with steady $100+/bbl oil prices. It will immediately have a big impact on killing projects and confidence, and this would take years to return something Saudi no doubt will be well aware of.
Analysis: Below is our unique analysis - based on our large oil export-import modelling - of the impact of the change in oil price in different countries finances. We have taken the net oil exports and imports of oil and calculated the annual revenue stream assuming $102/bbl for each major country in the world, and also all countries group into regions. Then we have assumed oil prices at $51/bbl - a halving - as has recently happened to mid December 2014. We have then calculated the net loss (red -ve) or gain (green +ve) for each country. Obviously the nations that import large quantities of oil gain, with those export large quantities losing revenue.
Results: The analysis shows that Saudi Arabia on an annualised basis would lose $-155.6 billion in export revenue. Russia would lose $-140 billion. USA would gain $144.7 billion. Iran would lose $-30.8 billion and Venezuela $-33 billion - large numbers for such small economies. China would gain $128 billion and Japan $82 billion. Looking a populations, this equates to giving a US citizen a tax break of ~ $480 per person per year, with Japan around $390 per person per year. As you can see, this stimulus is quite considerable and will benefit all oil importing nations moving into 2015. This should then feed through to property prices.
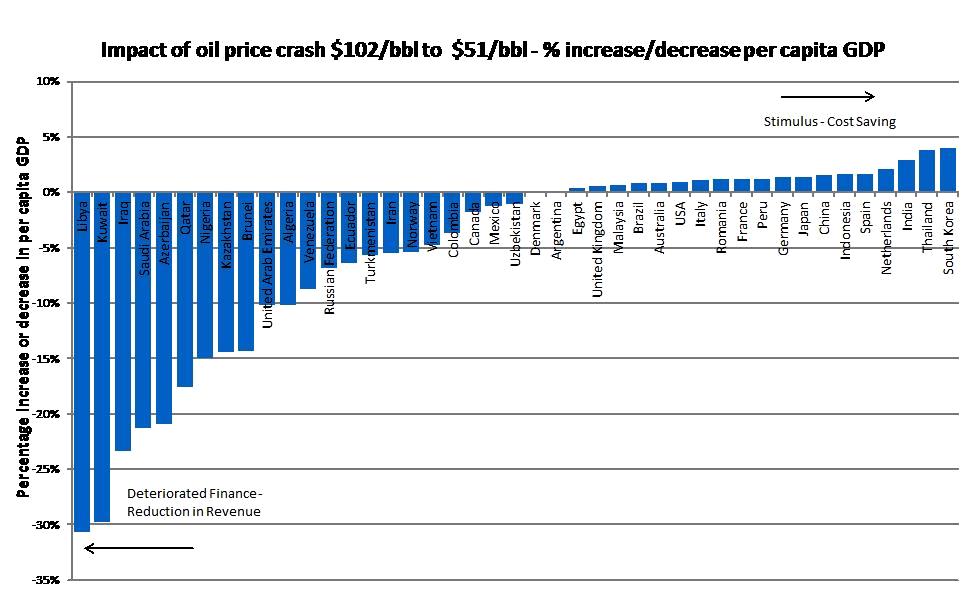
Per Capita Impact Modelling: We have also added each nation's population and GDP (2012$, around $102/bbl). We have also added the annual per capita in dollars (per person). If we then divide the loss-gain by the per capita, we get a % reduction or increase in per capita. This is a pretty good proxy for a fiscal tax stimulus (benefit) or fiscal tax burden (loss) per person. What is shows for example is that each Saudi citizen would long term see a 21% loss in their living standard. Each Libyan would see a massive -31% loss in living standards. However, each Chinese would see a +2% increase (like a 2% tax give away) and each South Korean would see a +4% increase. Based on this model, at $60/bbl - we would expect to see South Korean property prices to rise sharply in 2015.
| Country | Oil Export-Import '000 bbl/day | Surplus/Deficit $ Bln/year at $102/bbl | Loss/Gain $ Bln/year at $51/bbl | Population | GDP IMF 2012 $ (Wiki) | Per Capita $ IMF 2012 (Wiki) | Per capita gain-loss $/year | Proportional Gain/Loss per person |
|
Middle East |
|
|
|
|
|
|
|
|
|
Saudi Arabia |
8359 |
311.2 |
-155.6 |
29,195,895 |
727,307 |
25,085 |
-5329 |
-21.2% |
|
Iran |
1658 |
61.7 |
-30.9 |
76,954,000 |
548,895 |
7,211 |
-401 |
-5.6% |
|
United Arab Emirates |
2952 |
109.9 |
-55.0 |
8,264,070 |
358,940 |
64,840 |
-6650 |
-10.3% |
|
Kuwait |
2627 |
97.8 |
-48.9 |
3,582,054 |
173,424 |
45,824 |
-13651 |
-29.8% |
|
Iraq |
2630 |
97.9 |
-49.0 |
33,330,000 |
212,501 |
6,305 |
-1469 |
-23.3% |
|
Qatar |
1752 |
65.2 |
-32.6 |
1,864,817 |
183,378 |
99,731 |
-17485 |
-17.5% |
|
Europe |
|
|
|
|
|
|
|
|
|
Russian Federation |
7533 |
280.5 |
-140.2 |
143,400,000 |
2,021,960 |
14,247 |
-978 |
-6.9% |
|
Norway |
1484 |
55.2 |
-27.6 |
5,063,709 |
501,101 |
99,462 |
-5455 |
-5.5% |
|
Kazakhstan |
1544 |
57.5 |
-28.7 |
17,010,000 |
196,419 |
11,773 |
-1689 |
-14.3% |
|
Denmark |
1 |
0.0 |
0.0 |
5,605,836 |
313,637 |
56,202 |
-2 |
0.0% |
|
Turkmenistan |
97 |
3.6 |
-1.8 |
5,240,000 |
33,679 |
5,999 |
-343 |
-5.7% |
|
Azerbaijan |
772 |
28.7 |
-14.4 |
9,235,100 |
68,804 |
7,450 |
-1556 |
-20.9% |
|
United Kingdom |
-676 |
-25.2 |
12.6 |
63,705,000 |
2,440,505 |
38,589 |
198 |
0.5% |
|
Romania |
-99 |
-3.7 |
1.8 |
20,121,641 |
169,384 |
7,935 |
92 |
1.2% |
|
Uzbekistan |
30 |
1.1 |
-0.6 |
29,559,100 |
51,168 |
1,737 |
-19 |
-1.1% |
|
Netherlands |
-871 |
-32.4 |
16.2 |
16,801,900 |
773,116 |
46,142 |
965 |
2.1% |
|
Italy |
-1163 |
-43.3 |
21.6 |
59,704,082 |
2,014,079 |
33,115 |
362 |
1.1% |
|
Spain |
-1200 |
-44.7 |
22.3 |
47,059,533 |
1,352,057 |
29,289 |
475 |
1.6% |
|
France |
-1666 |
-62.0 |
31.0 |
63,886,000 |
2,608,699 |
41,141 |
486 |
1.2% |
|
Germany |
-2405 |
-89.6 |
44.8 |
80,493,000 |
3,400,579 |
41,513 |
556 |
1.3% |
|
Africa |
|
|
|
|
|
|
|
|
|
Nigeria |
2275 |
84.7 |
-42.4 |
173,615,000 |
268,708 |
1,631 |
-244 |
-15.0% |
|
Algeria |
1181 |
44.0 |
-22.0 |
37,900,000 |
207,794 |
5,694 |
-580 |
-10.2% |
|
Libya |
1303 |
48.5 |
-24.3 |
6,202,000 |
81,915 |
12,778 |
-3912 |
-30.6% |
|
Egypt |
-51 |
-1.9 |
0.9 |
83,661,000 |
256,729 |
3,112 |
11 |
0.4% |
|
North America |
|
|
|
|
|
|
|
|
|
Mexico |
855 |
31.8 |
-15.9 |
117,409,830 |
1,177,116 |
10,247 |
-136 |
-1.3% |
|
Canada |
1761 |
65.6 |
-32.8 |
35,141,542 |
1,819,081 |
52,232 |
-933 |
-1.8% |
|
USA |
-7772 |
-289.4 |
144.7 |
316,814,000 |
15,684,750 |
49,922 |
457 |
0.9% |
|
South America |
|
|
|
|
|
|
|
|
|
Venezuela |
1778 |
66.2 |
-33.1 |
28,946,101 |
382,424 |
12,956 |
-1144 |
-8.8% |
|
Ecuador |
286 |
10.6 |
-5.3 |
15,586,600 |
80,927 |
5,311 |
-341 |
-6.4% |
|
Colombia |
739 |
27.5 |
-13.7 |
47,265,000 |
366,020 |
7,855 |
-291 |
-3.7% |
|
Argentina |
-6 |
-0.2 |
0.1 |
40,117,096 |
474,954 |
11,576 |
3 |
0.0% |
|
Brazil |
-948 |
-35.3 |
17.6 |
193,946,886 |
2,395,968 |
12,079 |
91 |
0.8% |
|
Peru |
-127 |
-4.7 |
2.4 |
30,475,144 |
199,003 |
6,530 |
78 |
1.2% |
|
Asia Pacific |
|
|
|
|
|
|
|
|
|
Vietnam |
350 |
13.0 |
-6.5 |
88,780,000 |
138,071 |
1,528 |
-73 |
-4.8% |
|
Malaysia |
-109 |
-4.0 |
2.0 |
29,903,000 |
303,527 |
10,304 |
68 |
0.7% |
|
Brunei |
126 |
4.7 |
-2.3 |
393,162 |
16,628 |
41,703 |
-5951 |
-14.3% |
|
Indonesia |
-801 |
-29.8 |
14.9 |
237,641,326 |
878,198 |
3,910 |
63 |
1.6% |
|
Australia |
-631 |
-23.5 |
11.7 |
22,906,400 |
1,541,797 |
67,723 |
513 |
0.8% |
|
Thailand |
-764 |
-28.5 |
14.2 |
65,926,261 |
365,564 |
5,678 |
216 |
3.8% |
|
India |
-2888 |
-107.5 |
53.8 |
1,242,176,456 |
1,824,832 |
1,492 |
43 |
2.9% |
|
South Korea |
-2460 |
-91.6 |
45.8 |
50,219,669 |
1,155,872 |
23,113 |
912 |
3.9% |
|
Japan |
-4414 |
-164.3 |
82.2 |
127,350,000 |
5,963,969 |
46,736 |
645 |
1.4% |
|
China |
-6874 |
-255.9 |
128.0 |
1,354,040,000 |
8,227,037 |
6,076 |
95 |
1.6% |
|
|
|
|
|
|
|
|
|
|
|
Total For Regions |
|
|
|
|
|
|
|
|
|
Asia Pacific |
-22693 |
-845 |
422 |
|
|
|
|
|
|
Africa |
5539 |
206 |
-103 |
|
|
|
|
|
|
Middle East |
19911 |
741 |
-371 |
|
|
|
|
|
|
North America |
-5156 |
-192 |
96 |
|
|
|
|
|
|
S. & Cent. America |
359 |
13 |
-7 |
|
|
|
|
|
|
Europe & Eurasia |
-1476 |
-55 |
27 |
|||||
| Energyinsights.net analysis 19 Dec 2014 | ||||||||
Impact: For Europe and US businesses and investors, its broadly very good news. In all average areas it will create a big boost to real estate prices because:
· General inflation will crash meaning the Fed and Bank of England and European Banks will not be able to put up interest rates
· GDP growth should be stimulated is most countries, particularly countries with high oil import bills like Spain, Italy, Greece and France plus the USA
· As the global economy was slowing down it will boost overall growth except in major oil exporting nations
· Property prices in oil intensive areas like New York, California and most of NE USA will rise and be supported
· The increase consumer spending, particularly in countries with low government petrol-gasoline taxes like the USA will stimulate consumer spending and GDP growth
Crash On The Cards: However there will be some places were asset prices and business activity will either decline sharply or crash you will see this happening in the next 6-12 month
· UK Aberdeen (jobs losses, North Sea oil production crash and total collapse of drilling and development activity)
· UK Prime London property >£5 mln (less Russian, Middle East and African oil money)
· Norway Oslo, all areas will be affected
· Russia depression, all areas will be affected Moscow and St Petersburg property price crashes
· Saudi Araba, Kuwait, Iran, UAE, Qatar, Bahrain, Iraq, Oman property prices dropping sharply in $ dollar terms
· Venezuela long term depression with riots
· Nigeria destabilizing
· Gabon destabilizing
· Equatorial Guiness destabilizing
· Angola recession
· Libya continued turbulence and recession
· Egypt less money from Middle East partners destabilizing
· Australia particularly Perth, Melbourne and mining-oil-gas producing areas
· Canada Calgary (jobs losses, big drop in activity, boom goes bust)
· USA Texas and North Dakota (jobs losses, big drop in activity, boom goes bust)
· Malaysia - Kuala Lumpur (jobs losses, drop in activity)
The low oil prices will give a big boost to the economy - according to our modelling - in:
· China all areas particularly Shanghai
· All Asia Pacific oil importing areas
· Most European countries with high oil-gas import costs (all countries except Russia and Norway)
Currency Turmoil
The Russian Rouble has crashed to about 55% of its value since early 2014 partly because of sanctions, partly because of oil prices and the on-going Ukraine security situation/tensions. Its probably worth some analysis of currencies because this is likely play a key role in the next few years in regard to inflation expectations.
After the 2008 financial crash, the US Fed printed Trillions of dollars that were exported all around the world in an attempt to prop up and stabilize the global economy. This benefited emerging economies and also strengthened their currencies and lowered their inflation. However, as oil prices have now crash we expect to see the currencies of major oil exporting nations to crash and with this, inflation will rise sharply. But we might also see large outflows of money from these emerging economies - that is then invested in real estate in safe haven cities like New York, Singapore and London. So as the currencies in places like Iran and Russia crash, we expect to see more wealthy Iranians and Russians buying expensive West End London properties despite higher stamp duty.
Essentially the Trillions of dollars have got to come back one day and cause asset inflation in the developed countries. The assets most likely to explode in prices are high end real estate in major cities, art, wine and luxury goods. This happens when the super-rich elite families bail out of their emerging economies their homelands and shift into safe havens like New York and London.
Wars
It seems most likely the US-Saudi axis will cause economic collapse in Russia, Venezuela and Iran which is probably their plan. This is similar to 1986 when Regan and the House of Saudi manufactured the last massive oil price collapse that made Soviet oil uneconomic to export and directly led to collapse of the Soviet Union. The unfortunate thing about the existing Saudi-US strategy is that it had a high risk of making the heads of these countries coming out fighting as political pressure grows, particularly in Russia and Iran. So do not be surprized to see both Russia and Iran starting regional wars or at least creating major escalations in tensions in 2015.
As they say, it starts with trade wars (or sanctions), then we have currency wars (in this instance in the form of a manufactured oil price crash), then world wars (military excursions).
US Dollar
A the moment, everyone is thinking the US dollar is king the safe haven and indeed its a big turnaround since 2009 - its only been possibly because of oil-shale-fraccing, otherwise the US deficit would not have allowed the dollar to stay as king. But things can turn very quickly if a US financial contagion was to start, so dont be surprized in due course to see the dollar decline sharply then further money printing as the US economy slows down.
In the meanwhile, all major oil importing nations will see massive financial benefits from the almost halving of oil prices and this should keep the global economy from spinning into recession in the next few months. Our only caveat to this, is that so often, an oil price crash has been the precursor to a global recession. Its the market saying theres a major slowdown, lack of oil demand, recession on the horizon.
But an example of the positive impact of an oil price crash is in 1986 when Saudi flooded the world with cheap oil driving oil from $25/bbl to $8/bbl, which helped create the boom in 1987-1989. Then again when oil prices crashed to $9/bbl in 1999 this created a financial boom through to March 2000 and house price doubled in the UK from 1999 to 2005.
Modelling: We have also added each nation's population and GDP (2012$, around $100/bbl). We have also added the annual per capita in dollars (per person). If we then divide the loss-gain by the per capita, we get a % reduction or increase in per capita. This is a pretty good proxy for a fiscal tax stimulus (benefit) or fiscal tax burden (loss) per person.
What is shows for example is that each Saudi citizen would long term see a 21% loss in their living standard. Each Libyan would see a massive -31% loss in living standards. However, each Chinese would see a +2% increase (like a 2% tax give away) and each South Korean would see a +4% increase.
Another example is Russia, which will see per capita revenue drop by a large 6% because the economy is so reliant on oil revenues. This is therefore modelled to undoubtedly lead to a recession in Russia in 2015. Property prices will therefore drop sharply in dollar terms (even in the last few months, they have dropped by an equivalent 40% in dollar terms because the Rouble currency has crashed so sharply.
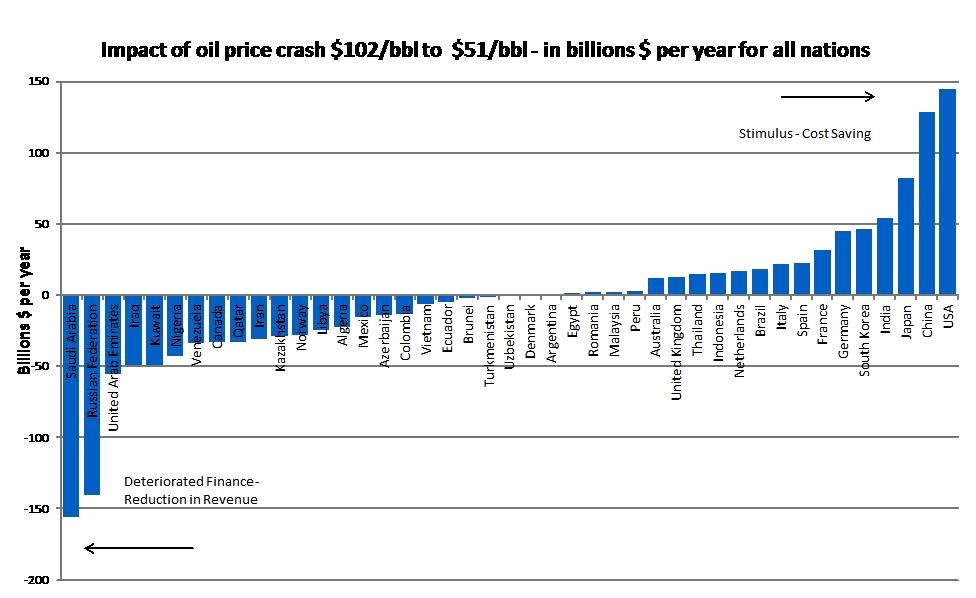
The chart below shows the actual dollar increase or decrease in cost or revenues in different countries - in billions of dollars a year. What this chart clearly shows is that - for example:
It doesn't take a rocket scientist to deduce that property prices in Japan and USA should rise along with economic stimulus-growth - whilst Russia and Saudi Arabia will see large drops and a recession.
Venezuela will see a drop of $33 billion in revenue in a small struggling economy highly dependant on oil revenues with a gigantic state public sector. Frankly Venezuela is predicted to have a collapsing economy in 2015 - default and strife if oil prices stay at $50-$60/bbl. Property investors should steer well clear of Venezuela. Iran will also see a $31 billion drop in revenues which should put further pressure on inflation as the currency declines and lead to far lower standard of living in Iran.
The UK should see a stimulus of a fairly meagre £12 billion. Oil companies will be hard hit in Aberdeen and London. The Treasury tax receipts will drop, but the economy should be boosted overall. Aberdeen should see property prices dropping sharply by about 10% in 2015, meanwhile house prices in England should be stimulated by lower general inflation, lower mortgage lending costs and improving employment prospects - as long as Labour win power in May 2015.
Tables of calculations made above:
| Country | Loss/Gain $ Bln/year at $61/bbl |
| Saudi Arabia | -155.59 |
| Russian Federation | -140.23 |
| United Arab Emirates | -54.96 |
| Iraq | -48.96 |
| Kuwait | -48.90 |
| Nigeria | -42.35 |
| Venezuela | -33.10 |
| Canada | -32.78 |
| Qatar | -32.61 |
| Iran | -30.85 |
| Kazakhstan | -28.73 |
| Norway | -27.62 |
| Libya | -24.26 |
| Algeria | -21.99 |
| Mexico | -15.91 |
| Azerbaijan | -14.37 |
| Colombia | -13.75 |
| Vietnam | -6.51 |
| Ecuador | -5.31 |
| Brunei | -2.34 |
| Turkmenistan | -1.80 |
| Uzbekistan | -0.56 |
| Denmark | -0.01 |
| Argentina | 0.11 |
| Egypt | 0.95 |
| Romania | 1.84 |
| Malaysia | 2.02 |
| Peru | 2.36 |
| Australia | 11.74 |
| United Kingdom | 12.59 |
| Thailand | 14.23 |
| Indonesia | 14.91 |
| Netherlands | 16.22 |
| Brazil | 17.64 |
| Italy | 21.64 |
| Spain | 22.34 |
| France | 31.02 |
| Germany | 44.78 |
| South Korea | 45.79 |
| India | 53.76 |
| Japan | 82.17 |
| China | 127.97 |
| USA | 144.68 |
| Country | Proportional Gain/Loss per person % |
| Libya | -30.6% |
| Kuwait | -29.8% |
| Iraq | -23.3% |
| Saudi Arabia | -21.2% |
| Azerbaijan | -20.9% |
| Qatar | -17.5% |
| Nigeria | -15.0% |
| Kazakhstan | -14.3% |
| Brunei | -14.3% |
| United Arab Emirates | -10.3% |
| Algeria | -10.2% |
| Venezuela | -8.8% |
| Russian Federation | -6.9% |
| Ecuador | -6.4% |
| Turkmenistan | -5.7% |
| Iran | -5.6% |
| Norway | -5.5% |
| Vietnam | -4.8% |
| Colombia | -3.7% |
| Canada | -1.8% |
| Mexico | -1.3% |
| Uzbekistan | -1.1% |
| Denmark | 0.0% |
| Argentina | 0.0% |
| Egypt | 0.4% |
| United Kingdom | 0.5% |
| Malaysia | 0.7% |
| Brazil | 0.8% |
| Australia | 0.8% |
| USA | 0.9% |
| Italy | 1.1% |
| Romania | 1.2% |
| France | 1.2% |
| Peru | 1.2% |
| Germany | 1.3% |
| Japan | 1.4% |
| China | 1.6% |
| Indonesia | 1.6% |
| Spain | 1.6% |
| Netherlands | 2.1% |
| India | 2.9% |
| Thailand | 3.8% |
| South Korea | 3.9% |