|
|
|
|
|
Introduction
Oil is a non-renewable resource. Hydrocarbons such as oil require millions of years to form. We can consider that the existing stock of oil in Earths subsoil a given; we cannot "increase" the reserves, just discover those that we still do not know of.
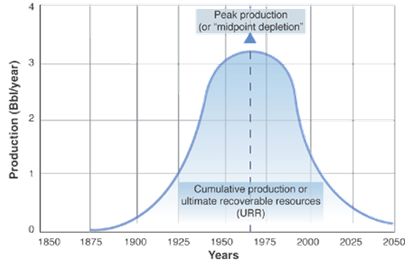
Every non-renewable resource coming from a finite storage can be exhausted, this exhaustion process can be described through a mathematical function and represented by a depletion curve. This theory of depletion of non-renewable natural resources was first put forward in the 1950s by King Hubert, a US geologist, based on actual observation of oil wells' production. Based on the analysis of new well discoveries in the United States, Hubert accurately predicted that the US production would reach a peak around 1970; the country reached peak production at about 3.5 billion barrels in 1971. In 1974, Hubbert (who passed away in 1988) also projected that global oil production would peak in 1995 at 40 billion barrels p.a. This prediction proved to be incorrect.
Peak Oil
d
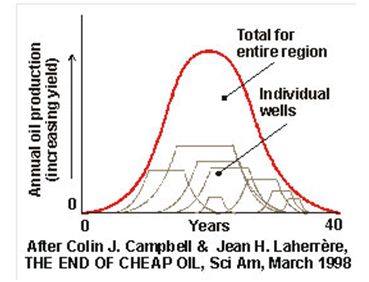
Individual wells, fields, countries, and the world follow a similar pattern.
Peak oil theory is well grounded in physics and mathematics, and there is little controversy that peak oil production for the world will eventually be reached at some point in the current century. The controversy is about when it will happen (some argue we are there already), what will drive it, and what its consequences will be.
Another topic of controversy is the relative steepness of the projected rate of decline of the production curve. This is, perhaps, the main cause for concern about the economic and social impact of peak oil production, because a steep drop in the production curve implies that global oil production will decline so rapidly that the world will not have enough time to develop sources of energy to replace the energy now provided by oil.
Discussions on when this will happen vary somewhere between now and in the next 30 years. The peak year may actually have been 2005, but the peak year will only become obvious in retrospect, many years after it happens.
A production peak may be driven primarily by structural factors: Because there arent enough reserves to economically satisfy a growing demand, prices would rise dramatically, resulting in a curtailment of demand, possibly in the context of a prolonged recession.
Or the production peak may be driven by other, more-optimistic reasons:
There will probably be a mixture of all of these, and that mix will determine how hard of a landing peak oil production will have.
This discussion is really a reprise, to a large extent, of the Malthus theory on the evolution of population and the evolution of resources to sustain it, particularly production of food resources.
Over the last 200 years, technological advances have systematically allowed the growth of food production (and other goods) to outstrip the very strong demographic growth. The question today is still whether or not technology will again save the day. There is no universal law guaranteeing that it will. On the other hand, we have started in recent years to see a substantial channeling of resources, both financial and intellectual, to the development of alternative energy technologies; for example, most of the top VC firms are now focusing on this space. This is encouraging.
A look at the numbers today
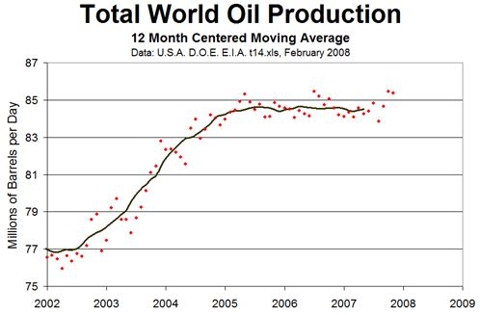
Current oil production stands at about 85 million barrels of oil per day, or just over 30 billion barrels per year (4.25 billion metric tons per year; a metric ton of oil corresponds to about 7.3 barrels).
The chart below shows the recent evolution of production, which has been rather stagnant since 2005.
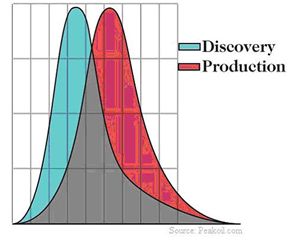
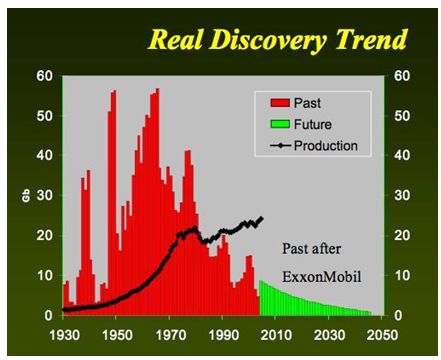
Discovery peaked 44 years ago (as can be seen in the chart below) at slightly above 60 billion barrels and is currently about 5 billion barrels per year, a sixth of current production/consumptiona 15% replenishment rate.

Worldwide proven crude oil reserves are estimated at 1,100 billion barrels, or 150 billion TOE. Europe and Eurasia, Africa, and South and Central America each have about 10% of the world reserves, but they are overwhelmed by the Middle East, which has over 60%.
Distribution of proven oil reserves worldwide by region:
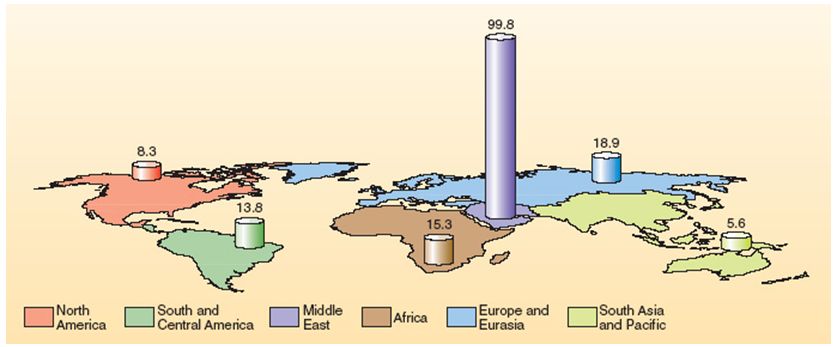
This level of proven reserves corresponds to about 35 years of current consumption levels; surprisingly, in spite of dwindling discoveries and growing consumption, this ratio (proven reserves relative to consumption) is at about the same level as in 1970, although it has come down a bit since 1990, after a peak of about 45 years.
Proven oil reserves expressed in years of current consumption:
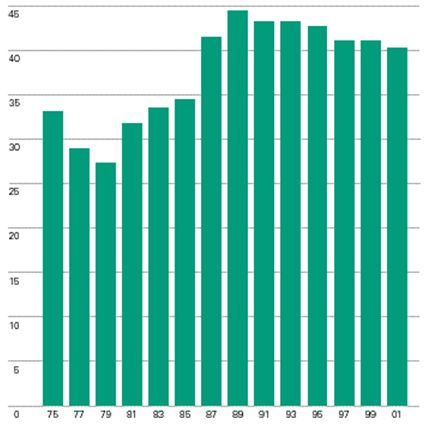
The reason for this stability is that stated oil reserves have increased substantially over an almost 40-year period.
Why?
"Reserves" is not a physical notion, but a political-technico-economical notion. As a result, the definition of "reserves" varies by country.
Some countries (such as the United States) define reserves as "oil that we reasonably consider to be able to extract in the future from the known physical resources, with the known techniques, and in the present economic conditions." These are also called "proven reserves."
In other countries, "reserves" generally correspond to the sum of 100% of proven reserves, 50% of the probable reserves, and 25% of the possible reserves.
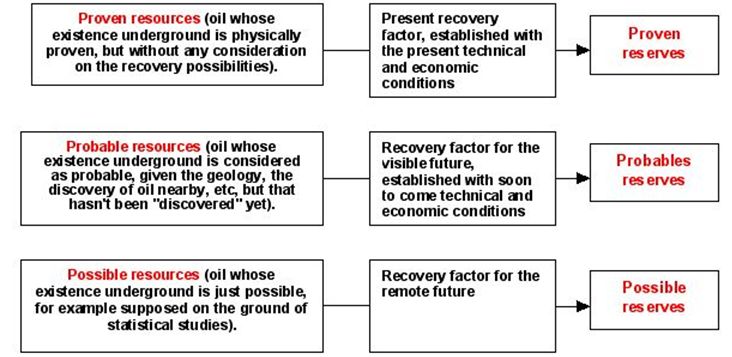
There are four drivers of reserve growth:
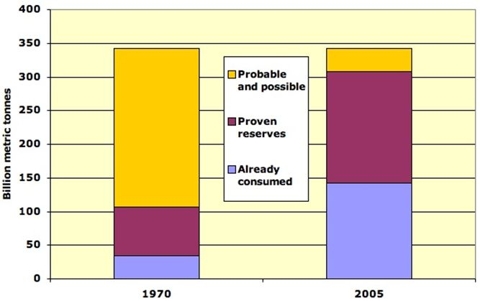
So the conclusion is that, driven by a variety of technical, economical, and political factors, proven reserves have increased because of a reclassification between types of reserves (between probable/possible and proven) rather than through new discoveries (which, as we have discussed, are very low). The chart below roughly illustrates what has happened.
How close are we to the peak?
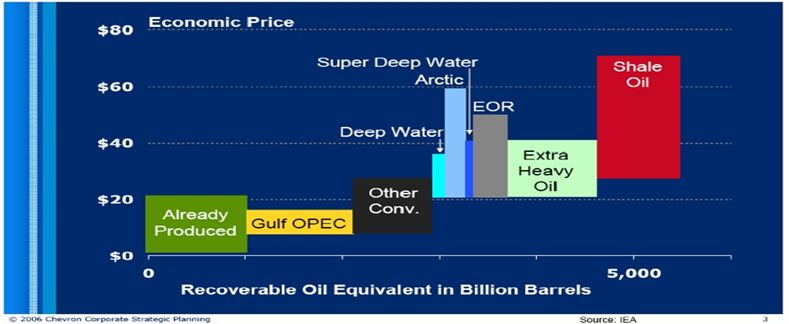
Recapping from our theoretical discussion on the depletion curves, the peak happens after discoveries have peaked, after consumption has overtaken discoveries, and once total accumulated consumption/production is roughly equal to the remaining reserves.
Looking at the numbers, one concludes that two of the conditions for a production peak have occurred, and a third may be occurring:
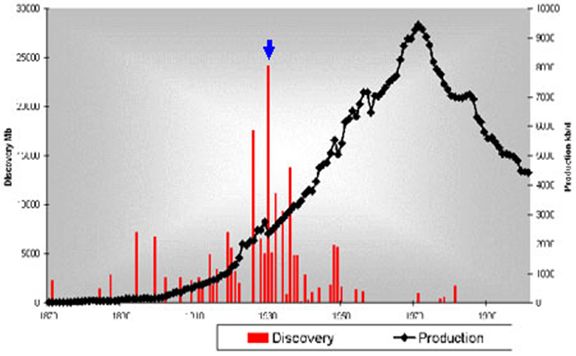
1) Discoveries peaked 44 years ago (by coincidence, the United States discoveries peak happened 41 years before peak consumption, although the lag for the worldwide case could vary substantially from the US case).
2) Consumption overtook discoveries in 1980, about 28 years ago (in the United States, consumption overtook discoveries about 32 years before the peak, again possibly just a coincidence of dates).
Global oil discoveries and production:
U.S. Oil discoveries and production:
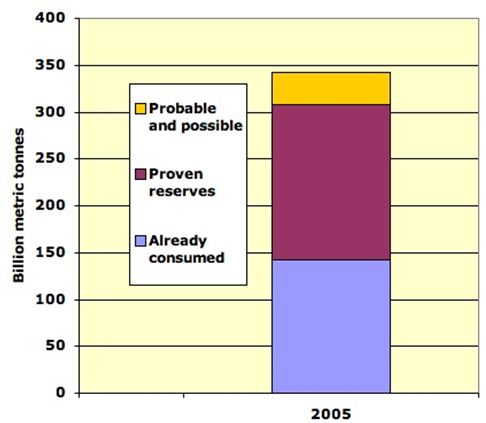
3) Total accumulated output may be roughly equal to existing proven reserves (this could vary somewhat, depending on estimates, and even more so on probable and possible reserves), the final condition, which is expected to coincide with Huberts peak. The chart below illustrates where we might be today.
In addition, (i) the flat output for the last three years and (ii) the decline (albeit slow) since 1990 of the reserves in terms of number of years of current consumption are not encouraging signs.
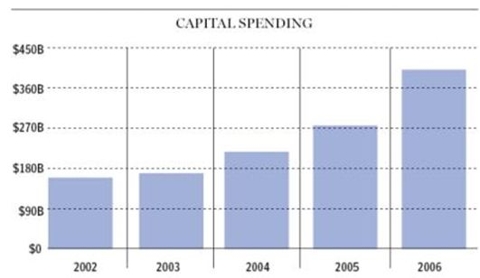
Finally, as illustrated by the chart below capital spending on oil and gas exploration has more than doubled since 2002 (for example, presently there are more oil rigs at work in the US than at any time in the last 20 years), but there has been no major change of trend in oil discoveries, at least not yet, although lag and inflation in production factors may be at play here.
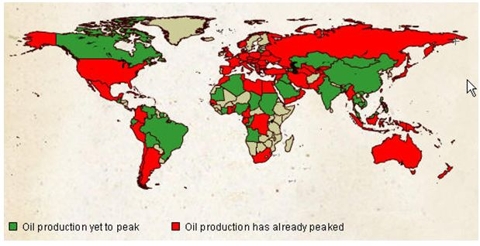
The map below shows in red the countries believed to be past their peak, and countries believed to be before their peak in green (but with many of these expected to reach their peak in the next 5-10 years). The largest producer, Saudi Arabia, is shown green, although some argue that it has already reached its peak. Saudis Gahwar field the largest oil field in the world is a particular source of concern as it is expected by several specialists that once the peak is reached its decline may be very fast.
Conclusion:
There are significant factors indicating that peak oil production is about to beor has already beenreached, but it is impossible to estimate/predict this with precision, and this will only be clear in retrospect. Regardless of the exact timeframe, the data shows that this is a pressing issue that will almost certainly affect the current generations. Further, there is a reasonable chance that, once the peak is reached, production may decline quickly, rather than slowly, causing at least significant economic crisis, although it could be much worse.
It is clear that the energy policies of the last 30 years, particularly in the United States (which consumes significantly more per capita as other developed nations (for example the US consumes about 25 barrels per person per day per year, almost twice the level in Japan, and 10 times more per capita than China), have served us poorly and have wasted the warning of the seventies oil crisis to reduce our dependence on oil. The Europeans have at least taxed gas heavily and have invested more aggressively on alternative energy and public transportation systems.
The prudent and reasonable approach is not to be in denial, but rather to assume that peak oil production may be nearly reached (or reached already), creating the sense of urgency needed to seek solutions and prepare accordingly for the potential consequences which may be grave.
In the meantime, the consequences for investors may also be extreme. Stagflation may be a likely result, this is an environment that is negative for equity markets. Fixed income investments are likely to perform even more poorly as interest rates are likely to rise. Gold as it correlates strongly with oil prices will likely outperform equities. Oil producing nations (Russia, Middle East, Nigeria, Angola, Brazil, Canada) are likely to fare relatively better than oil consuming nations (US, Western Europe, Japan, China).
In terms of sectors best bets would remain in energy sector both traditional and alternative. Best way to play the sector would be in oil field services particularly in companies with deep sea drilling capabilities, although I would like to point out that even in an escalating oil price environment it is possible for there to be an over supply of rigs and oilfield service companies which would put a downward pressure on day rates and profitability of these companies. Companies with access to reserves are also attractive investment opportunities particularly in countries where expropriation by the local government is less likely, so companies operating in Canada for example look quite attractive.
Finally, defense is also likely to do very well in this context. Oil producing countries will likely want to step up defense spending to protect their resources. And the global powers that are net importers such as U.S., China, India and Europe may feel tempted to use their military force to guarantee that oil producers have governments in place that will continue their supply to the global markets.